
What’s New in Canvas New Analytics?
What is Canvas New Analytics?
Canvas’ New Analytics feature isn’t necessarily “new,” but the “feature preview” is now available at ASU. Some of us may have tinkered with the Course Analytics feature that has long been available but felt hindered by the lack of usable data. The New Analytics feature provides new data, more powerful search capabilities, and the ability to message students directly from the page based on grade or participation. This article will:
- Compare Course Analytics and New Analytics to highlight new features,
- Demonstrate how to activate New Analytics, and
- Provide suggestions on using the data to improve student performance and course design.
What’s the Difference?
Since the available data is mostly the same, let’s start by highlighting the features of New Analytics that make it more impactful by looking at the four groups at the top of the landing page (#1 in the image below).
Course Grade Page
(#2) In the Course Grade and
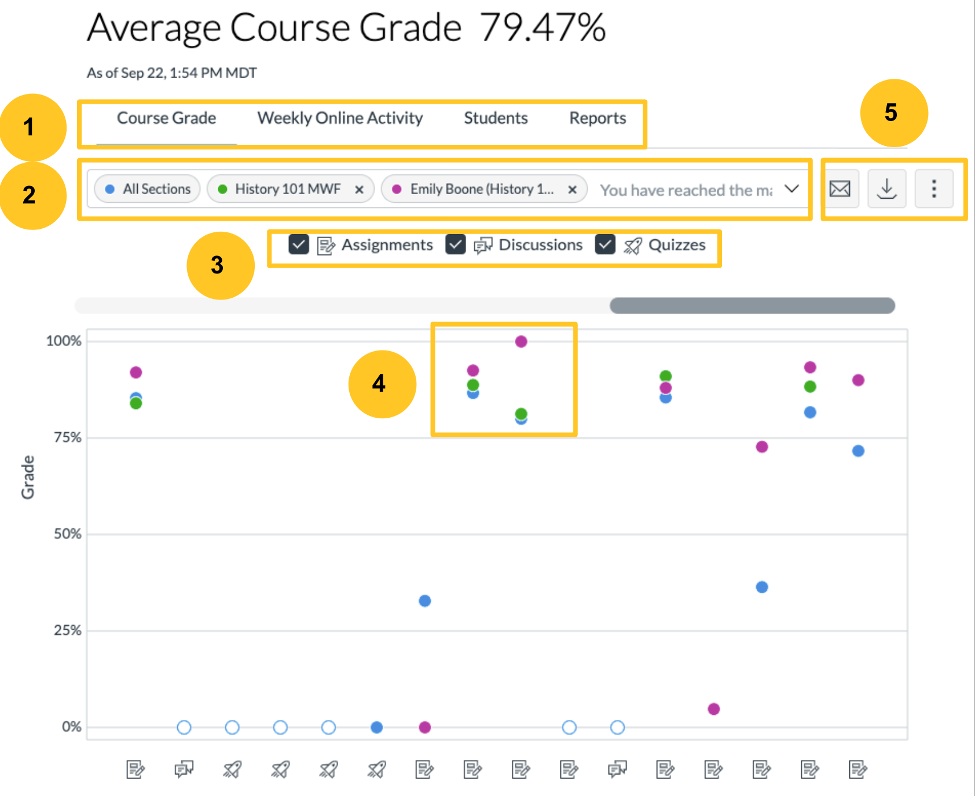
Weekly Online Activity pages, you can filter by section, student, and/or assignment to compare grades with the course average.
(#3) You can filter course grade data by assignments, discussions, and quizzes.
(#4) Clicking any of the data points on the chart will bring up a card detailing the average, high, and low grades as well as the number of late and missing submissions.
(#5) There are two great new features embedded on the Analytics page (and one familiar one):
- You can now use the “Message Students Who” feature to send a Canvas message to students who scored within a point range, submitted their assignments late, or have not yet submitted an assignment.
- You can now download all of the data to a CSV file for deeper analysis.
- Like before, you can view the data as a chart or as a table.
Weekly Online Activity
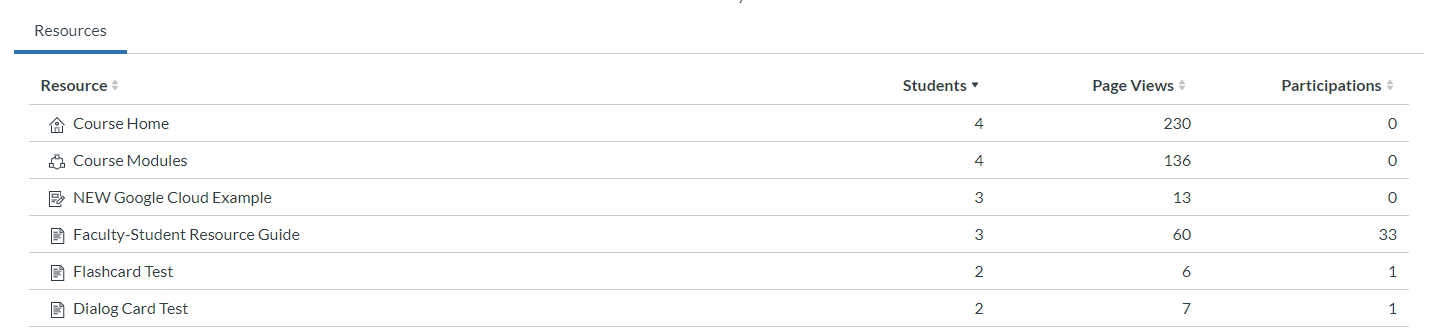
All of the sorting, filtering, downloading, and messaging features from the Course Grades page carry over to the Weekly Online Activity page, but one update that users may find especially beneficial is that they have added a list of all course “resources” below the summary charts. The resources could be a collection of Canvas content (e.g., modules or quizzes) as well as individual pages and assignments. You can also filter this list by the number of students who engaged, total page views, or total participations.
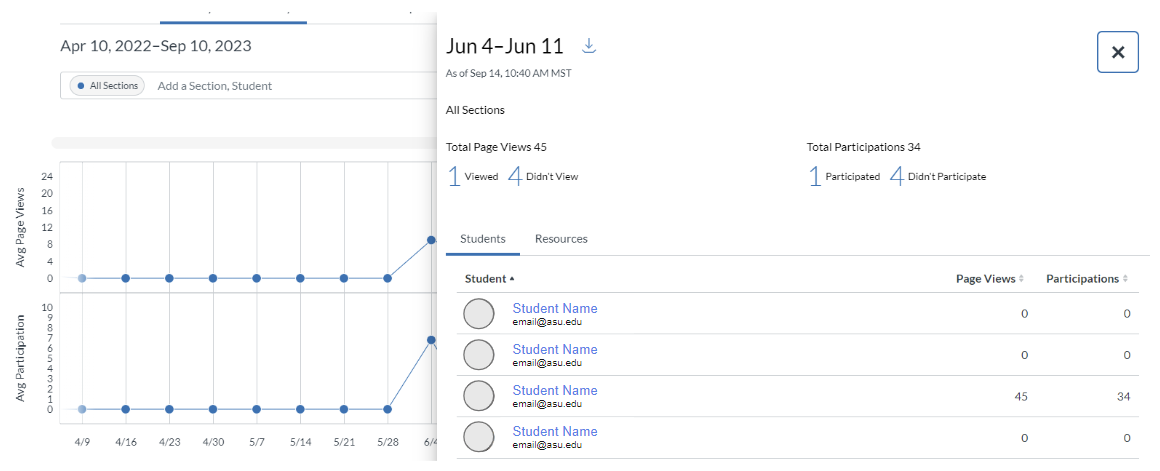
On the chart, if you click on any of the data points, it will open a card with more detail about a particular week’s activity which can also be sorted by student or resources. You can view and sort:
- Total page views with a breakdown of the number who viewed and the number who did not
- Total participations with a breakdown of the number who participated and the number who did not
- Page views by student or resource
- Participations by student or resource
You can also download a CSV file of this data view and click on an individual student name to bring up more detailed information.
Students
The Students page has a few updated data points from the previous Course Analytics which are highlighted in the table below.
| Data Point | Course Analytics | New Analytics |
|---|---|---|
| Number of page views | View and sort | View and sort |
| Number of participations | View and sort | View and sort |
| Number of submissions | View | |
| Number of on-time submissions | View | |
| Number of late submissions | View | |
| Number of missing submissions | View | |
| Current percentage score in the course | View and sort | View and sort |
| Percent of on-time submissions | View and sort | |
| Last participation date | View and sort | |
| Last page view date | View and sort |
Rather than just listing the number of submissions, New Analytics prioritizes views and participations by date as well as the total percentage of on-time submissions which is a better indicator of student progress. In addition, you can also filter by section or student, download a CSV file, or use the “Email Students Who” feature directly from the Students page.
Reports
The last page in New Analytics is where you can download five different reports:
- Missing assignments: a list by student name of any missing assignments, the points possible, due date, and unlocked date
- Late assignments: a list by student name of any late assignments, the points possible, due date, unlocked date, submitted date, and graded date
- Excused assignments: a list by student name of any excused assignments, the points possible, due date, and unlocked date
- Class roster: a list by student name containing contact and identifying information
- Course activity: a list by student name of engagement with course resources, times viewed, times participated, start date, first viewed date, and last viewed date
One caveat with the reports: Canvas warns that reports can take anywhere from 24 to 40 hours to run and be delivered. This could be challenging to use during a fast-paced online course if you’re looking to reach out to students who may need additional support. Still, it could be a fantastic post-course opportunity to assess your course design and student engagement.
Activating New Analytics
Luckily, activating New Analytics is an easy, three-step process. Review the steps below along with the visual example.
- Click “Settings” at the bottom of your Canvas course menu
- Click the “Feature Options” tab at the top of the page
- Locate “New Course and User Analytics” on the list and click the red circle with an “x” to activate the feature.
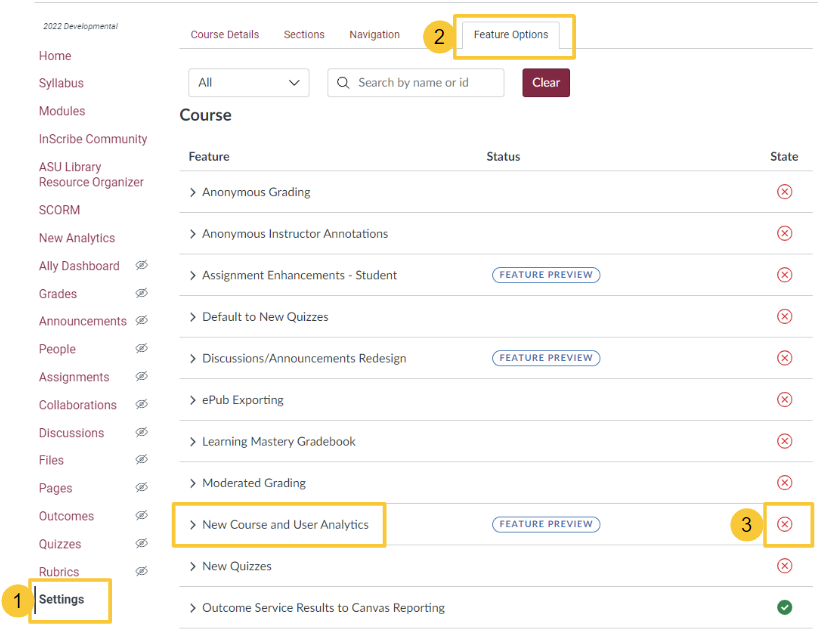
After activating New Analytics in your settings, you will see “Canvas New Analytics” show up on the right-hand side of your course landing page.
Ideas on Using the Data
Getting the data is great, but what now? Here are some ideas on how to use the data in New Analytics:
- Course Grade
- Examine the trendline to identify where student grades dip on assignments, discussions, and/or quizzes. What is it about the experience that students seem to struggle with the most? What additional support or scaffolding might be needed?
- Add sections or student groups to the filter to assess performance across different populations. Are there any differentiated outcomes between sections or groups that might need to be addressed? If you have grading or teaching assistants, do student outcomes appear consistent across your team?
- Weekly Online Activity
- Most faculty can point to a week, a day, or an assignment where they start to see students “ghost” or officially withdraw from the course. This data can help you pinpoint when and, perhaps, what course events make some students believe they won’t succeed.
- Reviewing page views on module overview pages, learning materials pages, and any page not associated with a grade can help identify which elements students are engaging with that are not directly impacting their grades. If the module overview pages aren’t getting a lot of clicks, might a more narrative and engaging overview that connects the module’s content with students’ lives garner more attention?
- Students
- Sorting by “Last Participation” date is another great way to check on students who are falling behind. Checking this once a week and using the “Message Students Who” feature could be a great way to proactively reach out to students who may need additional support.
- Once the course ends, downloading the CSV file for this page and sorting by page views could be another helpful way to see if there are particular points in the course where students start to doubt their ability to succeed.
- Use the “Message Students Who” feature to reach out to students:
- Within a lower-than-average score range to offer additional support before an upcoming assignment. Messages are sent individually to students and they do not see the other recipients, so be sure to use general but inviting language.
- Within an above-average score range to congratulate them on their success and see if they have any suggestions you can pass on to other students.
- Who are missing one or more assignments, especially the first three weeks of the course when students are often trying to figure out how to balance their course(s) with whatever other personal, professional, and academic responsibilities they have. If you notice that students are missing an early assignment, an offer of support can often go a long way.
- Who have submitted one or more assignments late. If you notice a trend, what barriers might that student be facing inside or outside of your course that are prohibiting them from turning in assignments on time? If you teach for ASU Online, this might be a great opportunity to suggest your student contact their Success Coach to get connected to relevant ASU resources to support their academic development and personal well-being.
- Reports
- As mentioned above, the delay of up to 40 hours on reports may not make this a great solution for “just-in-time” interventions, but it could be useful at the end of the course to assess:
- Course Design: Use the CSV file to sort the data by “Content Name” and “Times Viewed”. This could be a comprehensive way to see which non-graded pages are the most (and least) popular with students.
- As mentioned above, the delay of up to 40 hours on reports may not make this a great solution for “just-in-time” interventions, but it could be useful at the end of the course to assess:
- Student Engagement: If you offer students a choice between different assignment types, do you see particular options more students are drawn to? Is there an opportunity to offer more of those types of learning experiences in the overall course design?
Conclusion
Canvas’s New Analytics feature empowers faculty to better filter, sort, understand, and use their classroom data than ever before. With the advanced features, faculty are able to identify and quickly reach out to students who may be struggling or falling behind while also identifying opportunities to encourage students who are engaging above the course average. After the course concludes, Canvas New Analytics can help provide a comprehensive review to assess the effectiveness of the course design and facilitation.
Additional Resources
References
Figure 1. Miller, M. (2023, July 23). Screenshot of grade features in Canvas New Analytics. Adapted from https://community.canvaslms.com/t5/Canvas-Basics-Guide/What-is-New-Analytics/ta-p/73
Figure 2. Miller, M. (2023, July 23). Screenshot of personal Canvas DEV shell New Analytics page. Retrieved from secured site https://asu.instructure.com/courses/117871/external_tools/12209
Figure 3. Miller, M. (2023, July 23). Screenshot of personal Canvas DEV shell New Analytics page. Retrieved from secured site https://asu.instructure.com/courses/117871/external_tools/12209
Figure 4. Miller, M. (2023, July 23). Screenshot of Canvas settings page. Retrieved from secured site https://asu.instructure.com/courses/117871/settings#tab-features
Michael Miller is an Academic Success & Retention Specialist at EdPlus at Arizona State University.